Are you struggling to debug your Node.js server application effectively? Look no further! In this comprehensive guide, we’ll explore how to leverage Node Inspector to streamline your debugging process. Whether you’re a seasoned developer or just getting started with Node.js, understanding how to utilize Node Inspector can significantly enhance your debugging capabilities. Join us as we dive into the intricacies of Node Inspector and uncover valuable tips for debugging your Node.js server application like a pro.
What is Node.js?

Nodejs is an open-source cross-platform build on the V8 Javascript engine. It is a runtime environment for server-side application development. Nodejs comes with a peculiar non-blocking I/O model to create a scalable and applications. This can be helpful as an increase in demand for server-based applications.
Nodejs is written in basic programming languages like C, C++, Javascript. These applications can be run on Microsoft Windows and Linux operating systems.
Secondly, it is unbelievably lightweight, efficient, and its ability to produce highly reliable web applications. Using JavaScript on both frontend and backend opens new development paths in the world of web application development.
A rich library(NPM- Node Inspector Manager) of different JavaScript modules simplifies the whole web development process.
What is Node.js Inspector?
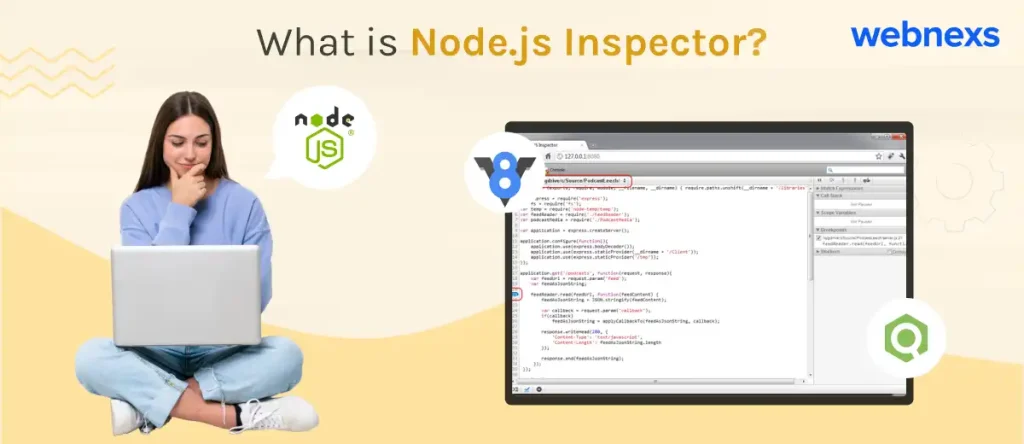
A debugger interface purely developed by the V8/Chromium team for Nodejs applications. It uses the Blink Developer Tools, formerly WebKit Web Inspector.
While using Chrome DevTools inspector, the Node inspector organizes your Nodejs development cycle for a clear workflow.
However, it avails you the option of automatically opening and closing Chrome DevTools in a window. To open DevTools, click the “Open DevTools” button. If the process sets to close, once you end your debugging session, DevTools will close automatically.
Read More: What is the Node inspector manager for the Nodejs application?
Advantages of using Node Inspector to debug NodeJS SERVER
Node Inspector acts as a great tool to debug a Nodejs application and server using the Chrome browser. Now it is easy to debug through all code blocks of JavaScript code using such an interface.
Node Inspector has some useful features that it provides to debug Nodejs based applications.
- It’s easy to step over-step in-step out and resume.
- Setting breakpoints for the JavaScript code.
- Inspect scopes, objects, and variables properties.
Debug Nodejs Servers WITH NODE JS INSPECTOR
Debugging is the predominant part of the whole software development cycle. In the software testing process, debugging is a much-needed functionality. When various subsystems are coupled, it likely to cause bugs. In particular, it is harder for complex systems to debug.
Thus, debugging in software development involves locating, correcting, and handling code errors in a computer program.
Why Start Debugging NodeJS Server
As everyone knows, it is common to make mistakes in code by the developers. Meanwhile, the debugger allows us to inspect the code on the go. Thus, this helps you to suspect a problem in implementation and application design.
But it is not convenient and flexible for large scale app development. Unlike the above-mentioned practice, an expert developer knows to use the power tools to debug their applications.
How to Debug a Nodejs Server WITH NODE INSPECTOR
Use the below command to install node-inspector to debug the Nodejs applications.
# npm install -g node-inspector
You can start your main Node application JavaScript file using the following command.
# node-debug app.js
This will load Node Inspector in your default browser, as the Chrome Developer Tools works. Such debugging features of Node Inspector support all the debugging features of DevTools to navigate in your source files.
CONCLUSION
Using Node Inspector is a great tool to debug a Nodejs server that saves your time greatly. It helps to fix all your code on the go and to have full control over code. With simple commands, debugging a Nodejs server is easy with Node inspector.
Contact sales experts to know about Nodejs and its developmental process.


Leave a Reply